Bibliometric Analysis using R
- Ehsan Moghadam

- Jun 20, 2023
- 2 min read
Updated: Aug 10, 2023
Did you know it is possible to explore research metrics using R studio's bibliometrix package? Let's test out this tool by performing our own bibliometric analysis.
To start, I enter an all fields search for the term SARS-CoV-2 which produces +50k results. According to Clarivate Analytics, who operate the WOS database, "Hot papers are papers that receive citations soon after publication relative to other papers of the same field and age." Now, let's perform our initial analysis, and explore the metaphorical temperature of these hot papers. An all fields search for the term SARS-CoV-2 was refined using the Hot papers quick filter on the WOS database, and exported according to the Full Record .bib format below:

Inside R Studio, the main library used is the bibliometrix package, an open-source tool for quantitative research in bibliometrics that includes all the main bibliometric methods of analysis. In addition, it features biblioshiny, an R shiny web application that provides routines for importing bibliographic data from several popular scholarly databases in order to perform bibliometric analysis.
To use the rbibliometrix package in R Studio, follow these steps:
1. Open RStudio: Start by launching the RStudio application on your system.
2. Check for updates: Ensure that your R and RStudio installations are up-to-date.
3. Open the console: Once you open RStudio, you will find a console at the lower left.
4. In the console, type the following command to install:
#Install the package
install.packages("bibliometrix")
#Load the bibliometrix package
library(bibliometrix)#Launch the biblioshiny web app
biblioshiny()Note: If your bibliographic records require deduplication, then use the following script:
#Load the bibliometrix package
library(bibliometrix)
#Import the .bib file
M <- convert2df("Filepath.bib", dbsource = "scopus", format = "bibtex")
#Deduplicate the data
M <- duplicatedMatching(M, Field = "TI", exact = TRUE, tol = 0.95)
#Check your data
head(M)
#Save the deduplicated data as an R data file
save(M, file = "Filepath.RData")
#Launch biblioshiny web application
biblioshiny()
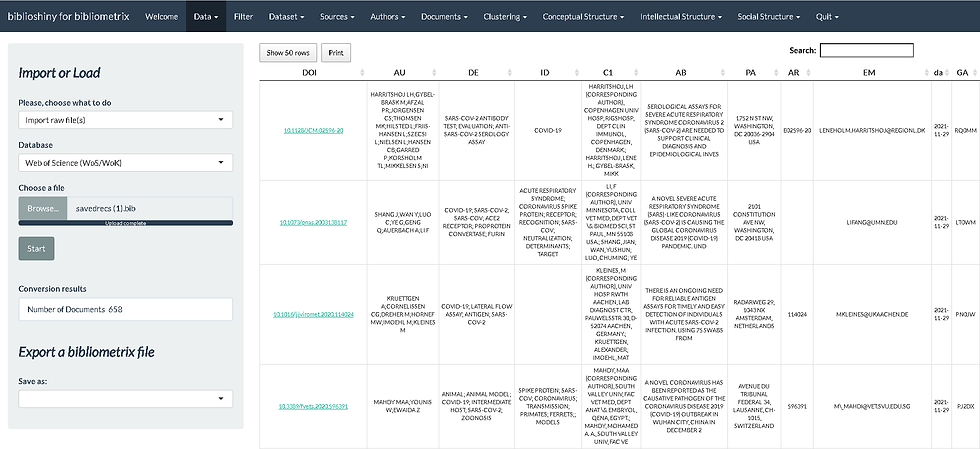
Once the bibliography records are imported and processed, a variety of visualization options become available. The main information found under the Dataset tab provides an aggregate collection of the main information from the bibliographic records. I can already see that 658 documents are written by 8844 authors, suggesting a large web of collaborations that can be visualized.
Moreover, the following word-based visualizations can be used to understanding the important terminology in current SARS-CoV-2 research efforts. These visual analytics are a great way for a new researcher to assess the most frequently used keywords in a field when looking for different concepts to research. Additionally, the thematic evolution function allows users to deep dive into the conceptual structure of the citation records by exploring the relationship between the terminology found within the individual publications.
Overall, this method of performing bibliometric analysis is perfect for those who wish to minimize coding and expedite visual analysis. In addition, it offers a great deal of visualization options that allow for advanced customization all inside a user friendly web app interface.
Resources:
Aria, M. (n.d.). Bibliometrix: An R-tool for comprehensive science mapping analysis [Computer software]. GitHub. Retrieved [insert date of retrieval], from https://github.com/massimoaria/bibliometrix
Bibliometrix: An R-tool for Comprehensive Science Mapping Analysis. (n.d.). Retrieved June 21, 2023, from https://www.bibliometrix.org/home/
Web of Science. (n.d.). Basic search. Retrieved [July 21, 2023], from https://www.webofscience.com/wos/woscc/basic-search
Gary Eckstein. (2022, July 13). Learn to use Bibliometrix for Simple and Powerful Literature Analysis (and Great Charts) [Video]. YouTube. https://www.youtube.com/watch?v=5nXzL2yCkGQ


Comments