Mona Chalabi's Impactful Work in Data Journalism
- Ehsan Moghadam

- Jun 19, 2023
- 3 min read
Updated: Aug 1, 2023
Welcome to the educational blog Infinidex.org. In this edition, we celebrate the awe-inspiring creations of Mona Chalabi, an extraordinary artist and data journalist renowned for her thought-provoking and visually striking masterpieces.
This data visualization by Mona Chalabi illustrates the remaining populations of endangered wildlife species across the world. In this work, Chalabi adapts the average size of each species to the exact spatial dimensions of a New York City subway car. The data was obtained from the International Union for Conservation of Nature (IUCN) “Red List.” Since most of the numbers on endangered species provide a range, a midpoint is used for each of them. The goal of the visualization is to inform and encourage people to become aware of the dangers facing endangered species and work towards solutions.
As someone who has traveled on the train, the depth of this artful visualization can be felt by how it communicates scale without the direct representation of numbers. Chalabi's ability to communicate complex topics through a distinctive style inspires me to develop my own expressive approach to data visualization. Exploring further, it becomes evident that she seamlessly combines classical statistical techniques such as charts, graphs, and maps with hand-drawn graphics. Over the past decade, Mona's portfolio has focused on various critical issues, including police violence, viral transmission, and the cost of dying. Her exceptional talent and expertise have gained recognition, leading to her work being featured in renowned publications such as the New York Times, the New Yorker, and the Guardian, where she currently holds the position of data editor
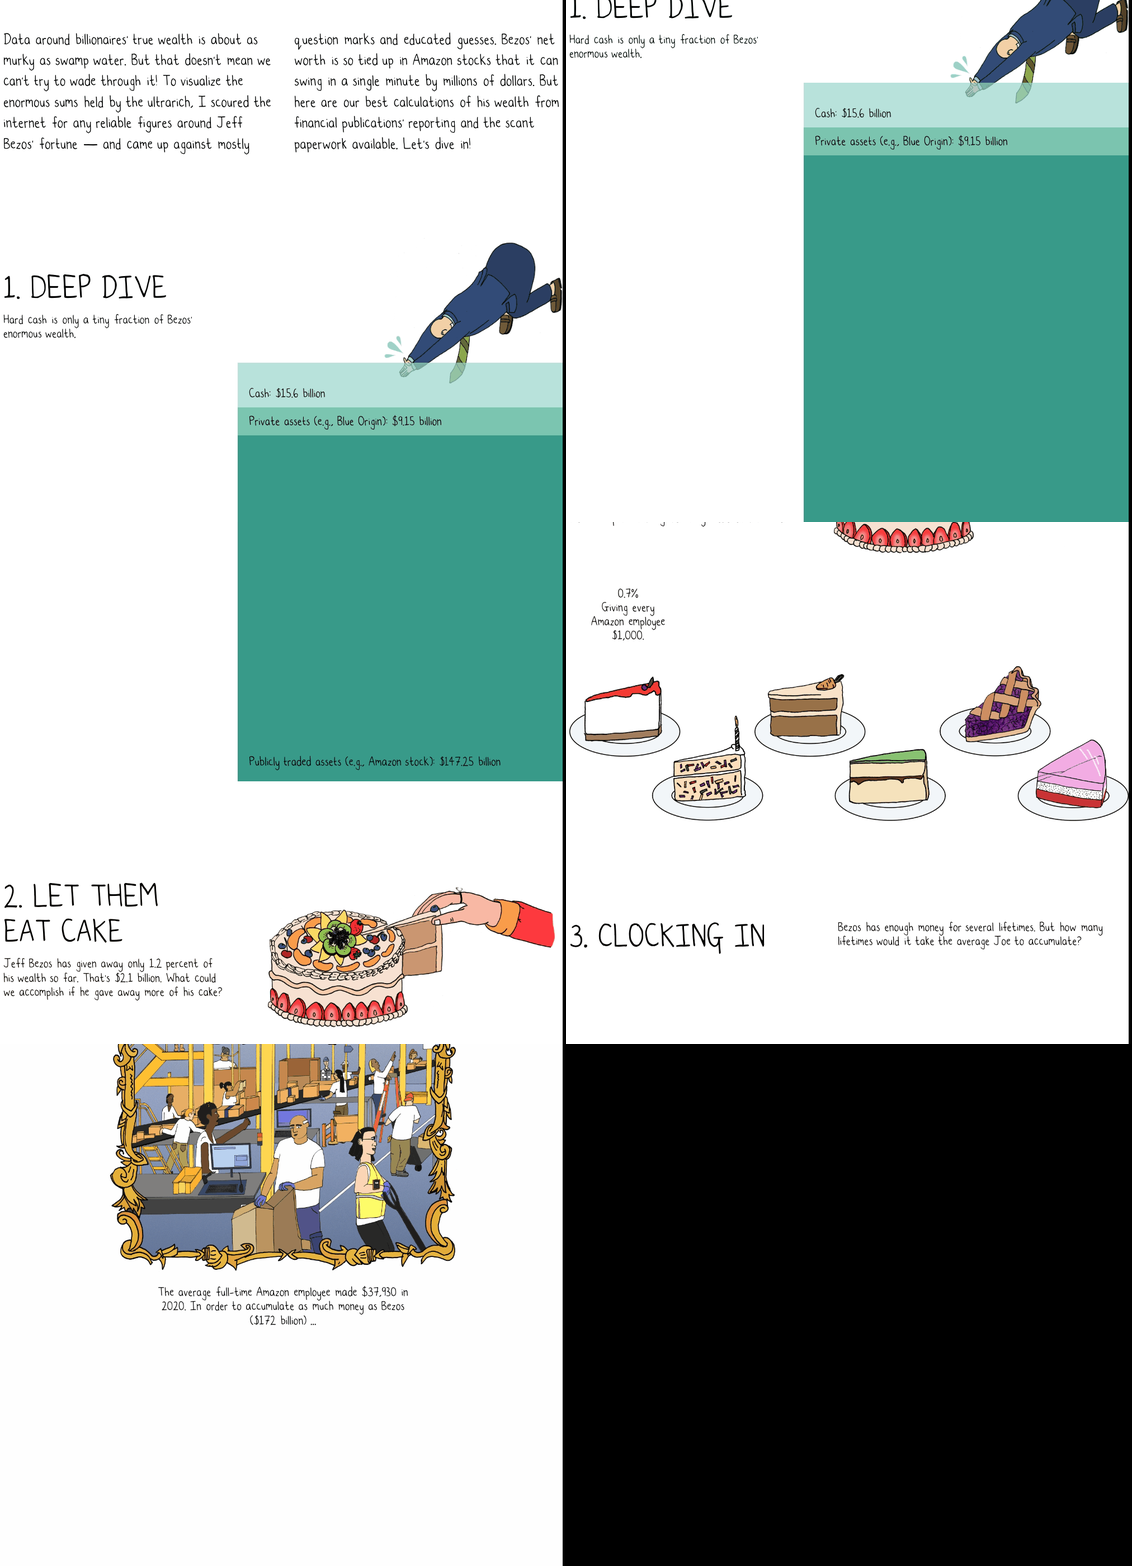
Most recently, Mona’s dedication to excellence and commitment to shedding light on complex topics have earned her the prestigious 2023 Pulitzer Prize in Illustrated Reporting and Commentary. Specifically, Mona was awarded for her distinguished portfolio of editorial cartoons and illustrated work that showcased political insight, editorial effectiveness, and public service value. Her compelling illustrations on the immense wealth and economic power of Amazon founder Jeff Bezos exemplify the meticulous and comprehensive approach she brings to her craft. In"9 Ways to Imagine Jeff Bezos' Wealth”, Mona explores the challenge of quantifying the true extent of billionaire wealth, specifically focusing on Jeff Bezos' fortune. With reliable figures often elusive, Chalabi incorporates data from the Bloomberg Billionaires Index to create a compelling depiction of Bezos' wealth. From highlighting the proportion of his holdings in cash, publicly traded assets, and private assets to exploring what could be achieved if he donated more of his wealth, each visualization delves into different aspects, offering thought-provoking insights into the colossal scale of wealth accumulation.

Mona Chalabi's talent lies not only in her ability to present statistical data but also in her keen analysis and insight. She weaves together storytelling, creativity, and a profound understanding of complex subjects to make data more accessible and relatable to a wider audience. As we delve further into the captivating world of data visualization, Mona Chalabi's work serves as an inspiration to the transformative power of data. Her contributions exemplify the fusion of art and information, captivating our imagination, sparking conversations, and shining a light on pressing societal issues.
References
The IUCN Red List. (2018, March 18). IUCN Red List of Threatened Species. https://www.iucnredlist.org/
Chalabi, M. (2018, September 16). Endangered Species on a Train. monachalabi.com. https://monachalabi.com/product/endangered-species-on-a-train/
Chalabi, M. (2022, April 7). 9 Ways to Imagine Jeff Bezos' Wealth [Interactive visualization]. The New York Times Magazine. Retrieved from https://www.nytimes.com/interactive/2022/04/07/magazine/jeff-bezos-net-worth.html


Comments